Italian Open Source Offering: 2008 VIU Research’s Findings
The Venice International University‘s research on Open Source in Italy, conducted by Antonio Picerni and Alessandro De Rossi, was presented last Tuesday at the VEGA technology park, in Venice.
Among the many findings presented – resulting from on-line surveys and interviews to 181 Italian firms – the research states that Italian IT companies offering solutions based on open source software reach bigger customers.
The Italian scenario.
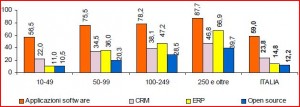
Open Source software in Italy is considered ready for prime time. ISTAT – the Italian National Institute for Statistics – reported that at the end of 2007 on average 12.2% of Italian enterprises using IT make some use of open source software. IT companies, insurance and banks are the most experienced in using open source (respectively 42.2 %, 39% and 34.1% of them), followed by electronic and optical manufacturers (24.7%).
Open source adoption scales with the dimension of the company, going from 10.5% for companies employing between 10-49 people, up to 39.7% for companies employing 250 people or more.
Assinform report 2008, now at its 39th edition, highlight all aspects of the Italian ICT Market, but say little about open source, though. Only 3 out of the many members of the Italian Association for Information Technology actually answered the survey, showing little interest from big companies in open source.
Research findings.
The VIU’s research depicts a situation where on average IT companies offering open source solutions have been seeing a significant increment on revenues (35.79 % between 2006 and 2007), but on average are small companies, employing less than 7 employees and with an yearly revenue of less than 500,000 euros.
It is interesting to notice that within companies employing more than 250 people the yearly revenue per person is higher, while on average is only 65,000 euros.
While 52% of surveyed companies work in the whole national territory, 47% of them are focused at regional or province level, and only 5% of them work abroad.
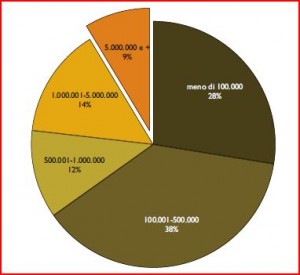
Looking at the numbers, 78% of revenues are distributed among companies generating globally (open source + not open source activities) less than 1 million of euros, and only 9% of them goes above 5 millions.
Open source revenues basically come from development/customization activities and consulting, training or hardware hardware selling leads are much less important. It is worth to mention that 46% of surveyed companies having a “mixed approach”, 60% of their revenues come from open source products or services.
Only 30% of them do steadily buy services from third parties to integrate their offer, while 73% of them declare to be actively involved in open source projects, and 59% as mantainer or with similar roles.
The cluster analysis identified three different groups.
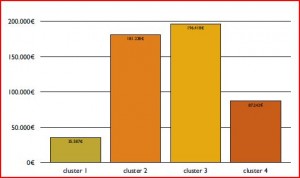
The first group are young companies – on average born around 2002, employing 10-19 people, with an yearly revenue between 100,000 and 500,000 euros – with a very high fraction of the total revenue coming from open source (75%). Usually companies in this group have a strong ethic foundation, and on average employees are graduated. Revenue per person fall behind 35,600 euros on average in this group.
The second group are medium size companies, with an high revenue per person (196,400 euros), usually system integrators working for telco, public administrations or big industries. On average the percentage of revenues coming from open source is low, or very low. For them open source software is neither an enabling factor nor a strategic choice. It is used if required by the customer (often a public administration) or because makes easier system integration activities.
The third group are still young companies, but are more productive companies, using open source also in combination with proprietary technology, like Oracle or SAP.
It seems like the third group is the winner. More on a later blog post.


First Draft » L’offerta di servizi open source in Italia 1:10 am on March 16, 2009 Permalink
[…] Cosa manca ancora a queste piccole imprese di servizi per diventare protagonisti del mercato? Roberto Galoppini lo ha messo in evidenza nella tavola rotonda che ha seguito la presentazione dei dati. Queste […]